Introduction:
In today’s digital landscape, where every click, transaction, and interaction leaves a trail of data, the ability to gain insights into system behavior and performance is paramount. Enter Prometheus – an open-source monitoring and alerting toolkit born out of the need to empower developers and operators with the tools necessary to gain deep visibility into their systems.
By the end of this guide, you’ll be well-equipped to embark on your own Prometheus journey, armed with the knowledge and confidence to configure Prometheus for enhanced observability in your environment. So, without further ado, let’s dive in and unlock the insights that Prometheus has to offer.
Relevance of Prometheus:
In the ever-evolving landscape of software development and operations, the need for robust monitoring and observability solutions has never been more critical. Prometheus, with its powerful capabilities and flexible architecture, has emerged as a cornerstone tool in the realm of monitoring and alerting. Let’s delve into why Prometheus is relevant and where it finds its applications.
1.1 The Rise of Observability
Observability, often touted as the holy grail of system understanding, refers to the ability to infer the internal state of a system based on its external outputs. Unlike traditional monitoring, which focuses solely on collecting metrics and alerting on predefined thresholds, observability emphasizes understanding and debugging complex distributed systems.
1.2 Prometheus: The De Facto Standard
Prometheus has established itself as the de facto standard for monitoring modern cloud-native environments, thanks to its robust feature set and active community support. Originally developed by SoundCloud, Prometheus was open-sourced in 2012 and later donated to the Cloud Native Computing Foundation (CNCF), where it has thrived as a flagship project alongside Kubernetes and others.
1.3 Where Prometheus Shines
Prometheus finds its applications in a wide range of use cases across industries and verticals:
- Containerized Environments: With native support for container orchestration platforms like Kubernetes, Prometheus excels at monitoring ephemeral workloads and dynamic infrastructure.
- Microservices Architectures: In the era of microservices, where applications are composed of numerous small, independently deployable services, Prometheus shines by providing service-level visibility and insights into inter-service dependencies.
- Cloud-Native Ecosystem: Prometheus seamlessly integrates with other CNCF projects like Grafana, Thanos, and Cortex, forming a comprehensive observability stack tailored for cloud-native environments.
- DevOps Practices: Prometheus aligns perfectly with DevOps principles, enabling developers and operators to collaborate effectively by providing a common platform for monitoring and troubleshooting.
Configuration Steps:
Step 1: Download prometheus package via wget
wget https://github.com/prometheus/prometheus/releases/download/v2.23.0/prometheus-2.23.0.linux-amd64.tar.gztar -xvf prometheus-2.23.0.linux-amd64.tar.gz

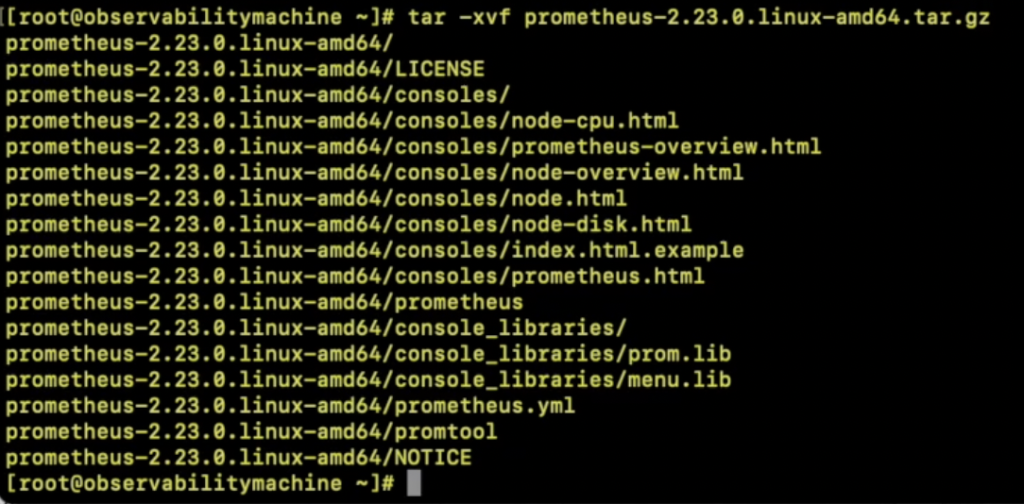
Step 2: Untar the package
tar -xvf prometheus-2.23.0.linux-amd64.tar.gz

Step 3: Copy the scripts to /usr/local/bin
Copy the scripts to /usr/local/bin
cp prometheus-2.23.0.linux-amd64/prometheus /usr/local/bin
cp prometheus-2.23.0.linux-amd64/promtool /usr/local/bin

Step 4: Create a prometheus directory in /etc and copy the following dir to the newly created one
mkdir -p /etc/prometheus
cp -r prometheus-2.23.0.linux-amd64/consoles /etc/prometheus/
cp -r prometheus-2.23.0.linux-amd64/console_libraries /etc/prometheus

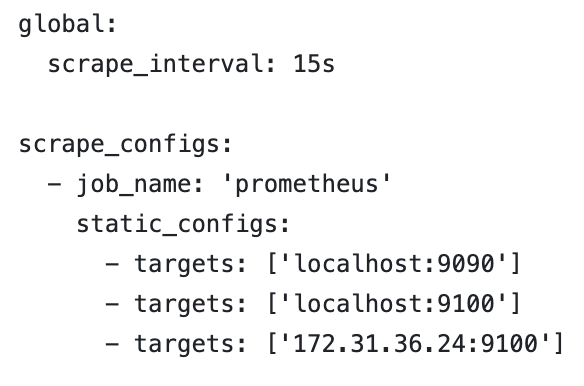
Step 5: Configure prometheus.yml
vi /etc/prometheus/prometheus.yml

Step 6: Create a user representing the prometheus service and create /var/lib/prometheus dir
sudo useradd prometheus –no-create-home –shell /bin/false
sudo mkdir /var/lib/prometheus

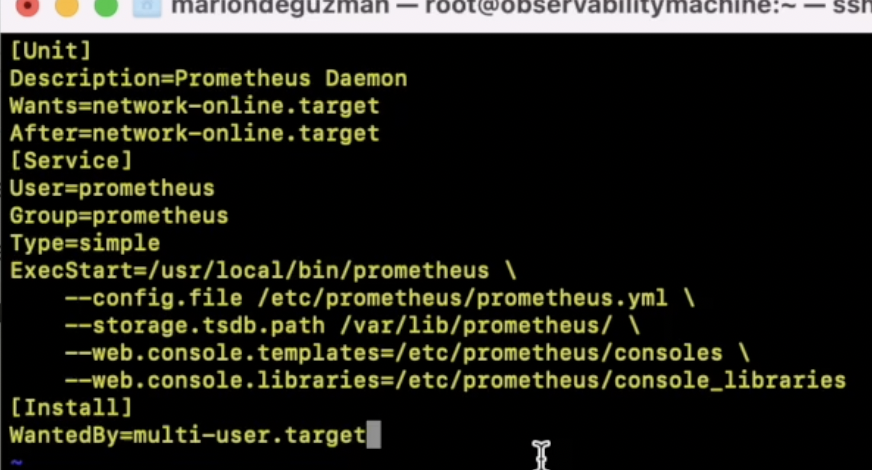
Step 7: Create a prometheus service file
vi /etc/systemd/system/prometheus.service
[Unit]
Description=Prometheus Daemon
Wants=network-online.target
After=network-online.target
[Service]
User=prometheus
Group=prometheus
Type=simple
ExecStart=/usr/local/bin/prometheus \
–config.file /etc/prometheus/prometheus.yml \
–storage.tsdb.path /var/lib/prometheus/ \
–web.console.templates=/etc/prometheus/consoles \
–web.console.libraries=/etc/prometheus/console_libraries
[Install]
WantedBy=multi-user.target

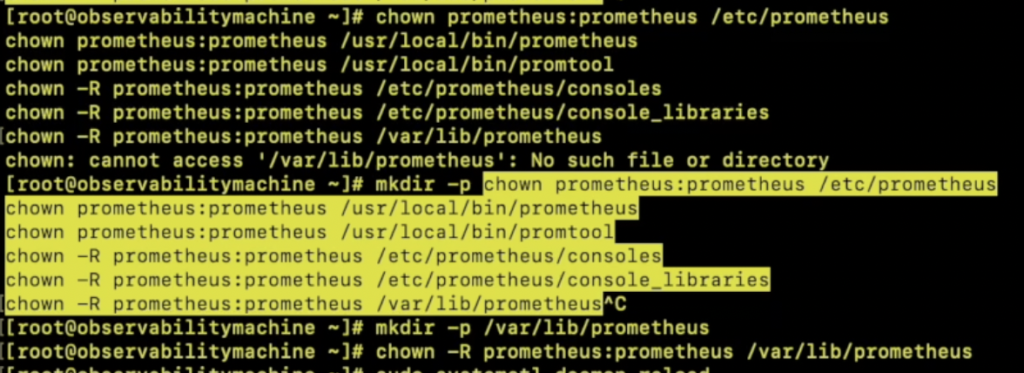
Step 8: Modify the necessary directory and files to be owned by prometheus
chown prometheus:prometheus /etc/prometheus
chown prometheus:prometheus /usr/local/bin/prometheus
chown prometheus:prometheus /usr/local/bin/promtool
chown -R prometheus:prometheus /etc/prometheus/consoles
chown -R prometheus:prometheus /etc/prometheus/console_libraries
chown -R prometheus:prometheus /var/lib/prometheus

Step 9: Reload System daemon

Step 10: Start and enable prometheus service

Conclusion:
In conclusion, mastering the configuration of Prometheus opens a gateway to unparalleled observability in your systems. With Prometheus as your ally, you’re empowered to navigate the complexities of modern cloud-native environments with confidence, ensuring the reliability and performance of your applications. So, embrace Prometheus, unlock its full potential, and embark on a journey of continuous improvement in monitoring and observability.
Conclusion:
By following these steps, you’ve successfully deployed Node Exporter as a daemon service on your Linux system. This setup ensures that Node Exporter runs persistently, providing valuable system metrics for monitoring and analysis.
Related Topics:
Linux Articles:
Email Sending in Linux Machine Using Postfix
Tips on How to Pass RedHat Certified Systems Administration Exam
Career Story of a Linux Application Support Engineer: A Journey of Dedication, Resilience, and Excellence
Tips on How to Become a Successful Linux Application Support Engineer
Is Linux in Demand in the Philippines
Unlocking Foundations in Devops: Why Linux is crucial?
Observability Related Topics:
SRE Observability Course
What is Observability?
How to setup a Node Exporter?
Deploy Node Exporter as a Daemon Service

2 thoughts on “Observability: Configure Prometheus Service”
Comments are closed.